- Home Page
-
About Us
-
History
Sisoft, founded in Sivas in 1987 by Ömer Siso under the title "Çözüm Bilgisayar incorporated in 1989..We started to develop our softwares in those years. Çözüm Eczane (Pharmacy) and Medication Tracking which are the first DOS-based softwares in 1988, upon request of Op. Dr. Ahmet ÜSTÜN, Head Physician during those dates, were used in SII Tokat Hospital through BASIC. Due to data storage and capacity problems, codes are developed again via dBase. When it's required to use a Main Engine so as to perform it with more than one terminal, dBase is found overpriced, so it's decided to use Clipper Summer 87 More...
Our Vision : To provide end-to-end sustainable solutions for stakeholders in healthcare with human centric approach.
Our Mission : Shaping the future of healthcare IT and improving the quality of people's life through innovative software and integrated solutions.Memberships
Introductory Films
-
-
Products
-
All Sisoft products, are offered by going through advanced level of engineering and security processes.
-
-
Success StorIes
-
PublIcatIons
-
Contact Us


PROGNOSIS OF UROLOGIC DISEASES VIA DATA MINING METHODS
ANKARA,2019
Diagnosing process is an important decision stage for doctors. There is always the possibility of making mistakes, as a prognosis is often determined based on images and numerical data. In particular, data retrieval where there are differences in images may lead to misdiagnoses. As a result of this, the world of medicine is the field that shows the utmost interest in computer and electronic products today.
These methods help doctors decide in the diagnosis and treatment of the diseases. In this study, prognosis and diagnosis procedures of urological diseases were examined.
1. Introduction
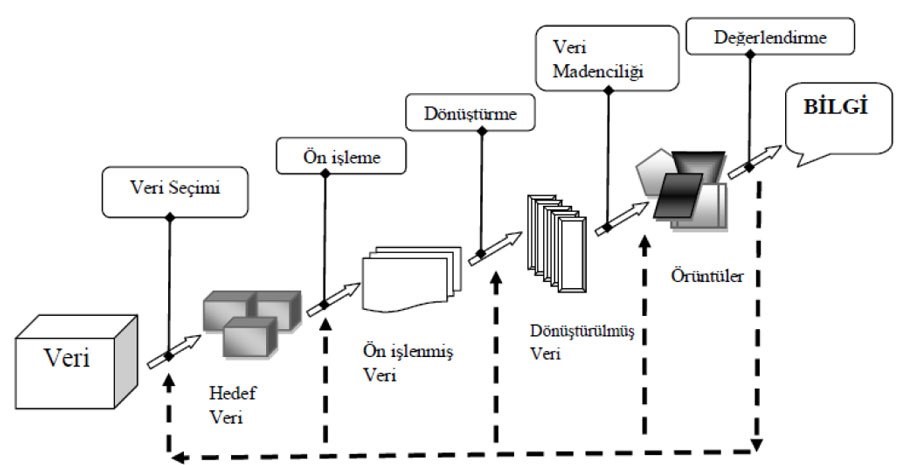
Data mining is a process where we obtain important information from large data sets. It has a wide range of applications ranging from risk analysis in banking, prevention of irregularities in insurance, diagnosis of disease in medicine, and quality control in the industry.
Data mining consists of the following processes:
1.Cleaning the data
2.Integrating the data
3.Selecting the necessary data
4.Formatting data
5.Data mining
6.Analysis of the obtained patterns
2. FREQUENTLY ENCOUNTERED PROBLEMS in DATA MINING
In data media having large volumes of data, major problems may occur. Therefore, data mining systems prepared in small data sets and simulation media may work incorrectly in media with large volume, missing, noisy, null, garbage, outlier or uncertain data sets. Thus, these problems need to be solved while preparing data mining systems.
The problems that may occur in data mining practices are:
Redundant Data:
The redundant data are the unnecessary attributes in the sample set used to obtain the desired result in the problem. It may be encountered during many operations.
Uncertainty:
It is related to the severity of errors and the noise level in the data.
Empty Data:
It is due to the size or nature of the data set. Here are the things to do when you have missing data:
♦Record(s) with missing data may be removed.
♦ Instead of missing data, the mean of the variable may be used,
♦ The optimal value may be used based on existing data.
Missing data create important problems in the statistical analysis since statistical analysis and related package programs that allow these analyzes to be performed have been developed for cases where all of the data exists.
Processing Different Types of data:
Real-life applications require processing not only on symbolic or categorical data types as in machine learning, but also on different types of data, such as integers, fractional numbers, multimedia data, and geographic information data.
Noisy and Missing Values:
Off-system errors that occur during data entry or data collection are called noise. In large databases, the value of many attributes may be incorrect. Errors that occur during data collection are combined with measurement errors. As a result of these errors, the value of many attributes may be inaccurate and due to these inaccuracies, the data mining may not fully meet the desired goal.
Limited Information:
The databases are generally designed for non-mining purposes, such as offering features or attributes that provide simple learning tasks. Therefore, some features to facilitate the learning task may be missing.
Database Size:
Database sizes are increasing rapidly. The database algorithm has been developed to handle a large number of small samples. That's why too much attention is needed to use the same algorithms in hundreds of times larger samples.
Before proceeding with data mining analyzes, the data must first be formatted. Data mining methods can be grouped under three general headings as rule extraction, classification, and clustering. Apriori method is the most commonly used method as the rule extraction method. Classification methods are Decision Tree (DT), Bayesian Classification (BC), and Artificial Neural Networks (ANN) where clustering methods include K-mean and Genetic Algorithm (GA). In this study, classification methods were used for the 20 most common diagnoses and the results were compared.
The urinary system which serves to remove harmful, useless or excess substances from the body consists of two kidneys, two urinary tubes, bladder, and urinary tract. The first symptoms of the urinary system diseases are disorders such as pain, irregular urination, and edema. In medical language, the condition where you have difficulty in urinating and feel burning and pain is called dysuria.
In this study, classification methods were applied for the diagnosis of renal, urinary tract and reproductive system disorders and algorithms were compared.
WEKA software was used for data mining and machine learning analyzes. WEKA allows extracting information from data thanks to various algorithms within itself.
Many algorithms within WEKA such as J48 Algorithm, Random Forest Algorithm, RePTree Algorithm, Decision Table, AdaboostM1 Algorithm, IBk Algorithm (K nearest neighbor), Kstar Algorithm, MultilayerPerceptron Algorithm, Regression Algorithm, and NaiveBayes algorithm were applied on the model.
Randomforest algorithm will be used in other parts of the application since it is the classification algorithm with the highest accuracy as seen in Table 2.
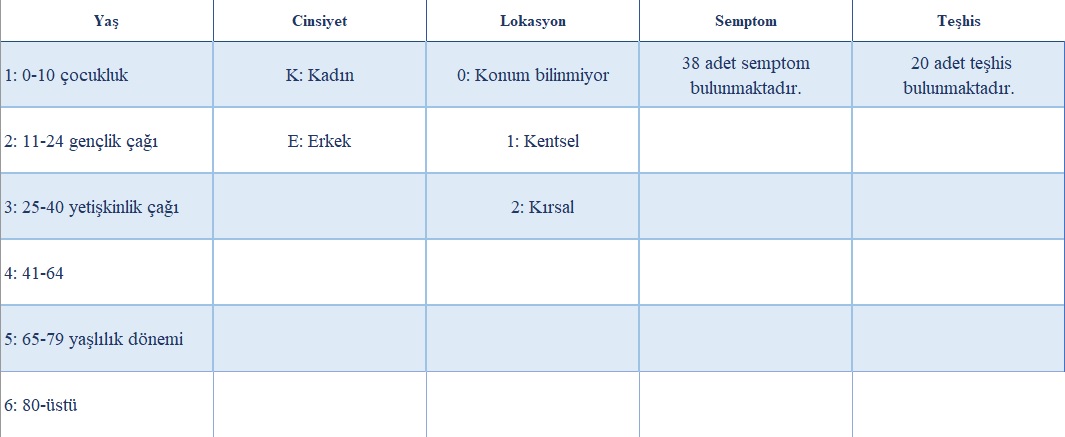
There are 5 types of variables related to the patients in this database:
The data includes patient numbers, age, gender, location, marital status, nationality, disability status, symptoms, and diagnosis of the patients. Some of these data have missing observations, outliers, and loss observations. Since these data are thought to have a negative effect on the performance of the model, it was identified and cleaned, and all the data were combined into a single file. The numerical values in the data set were grouped.
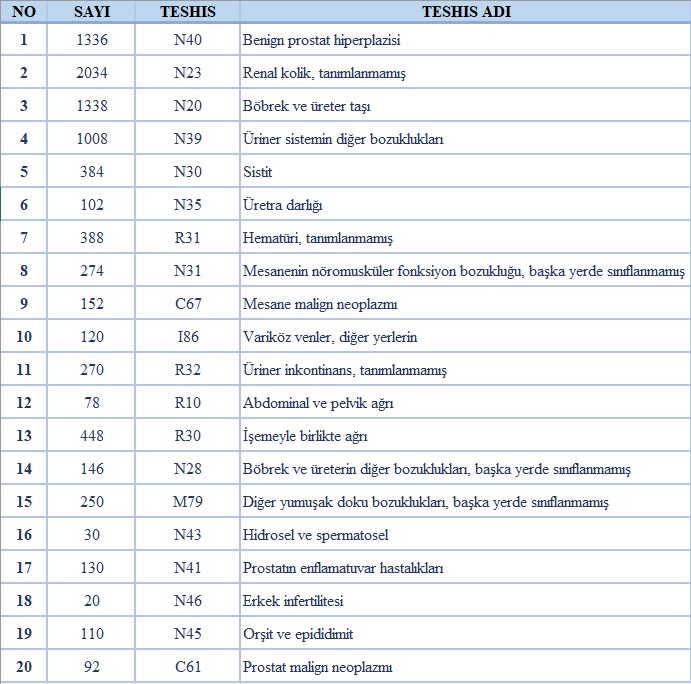
Diagnosis List
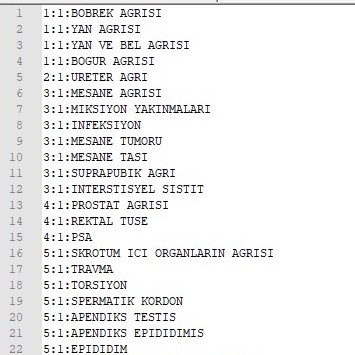
Symptom List
There are 38 symptoms in the symptom list. Some of them are shown in the table below:
3. Implementation
3.1.Data Mining Analysis and Implementation of Models
After the data preprocessing step, the modeling step was started. Different algorithms were tried on the data set to compare their success rates and the algorithm giving the highest success rate was selected.
3.1.2.Models
Classification is the assignment of a new object to a previously created class by examining the attributes of the object. The main priority in the classification process is to clearly identify the characteristics of all the individual classes.
Decision Trees
Decision trees are one of the most commonly used algorithms for solving classification problems because they are easier to construct and understand than other algorithms.
There are many algorithms developed based on decision trees. Some of those are;
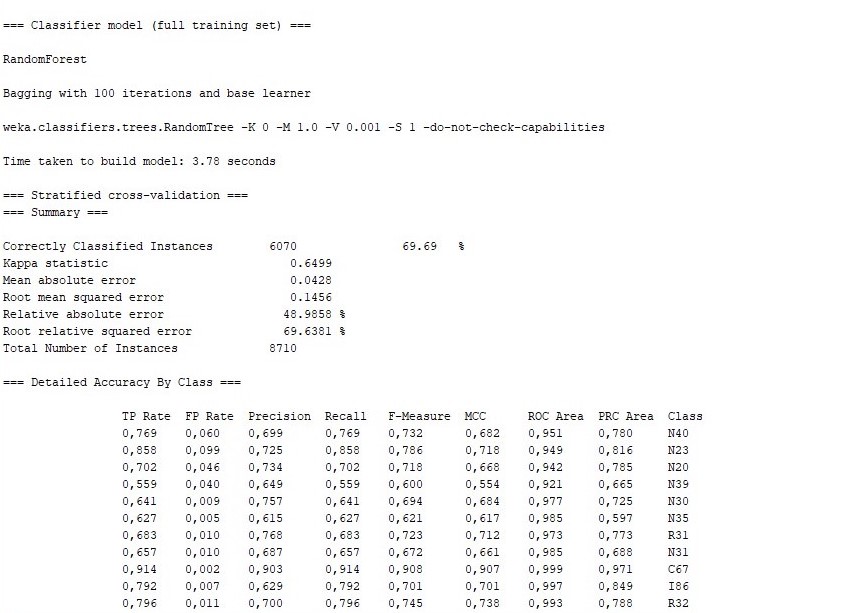
Using RandomForest algorithm;
Model success was found to be 69.69%. There is a 69.69% success in predicting diagnoses, and 6070 out of 8710 data are correctly identified.
♦Results Obtained Using RandomTree Algorithm
Confusion Matrix
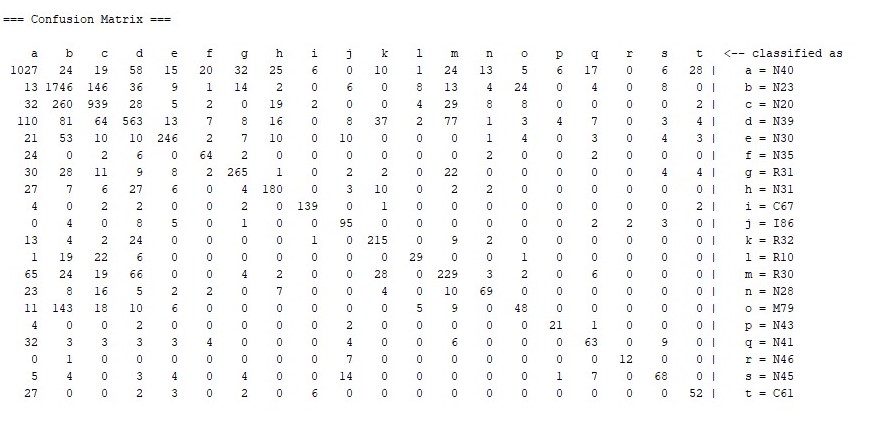
♦ Confusion Matrix: It is very useful for understanding the results in classification problems. Returns the actual values and the estimated values in the same table. The Confusion Matrix shows not only how the model is predicted, but also where the misclassified values are in detail.
♦ Among the 1336 Benign Prostatic Hyperplasia (N40) data, 1027 were correctly diagnosed.
♦ Among the 2034 Unspecified Renal Colic (N23) data, 1746 were correctly diagnosed.
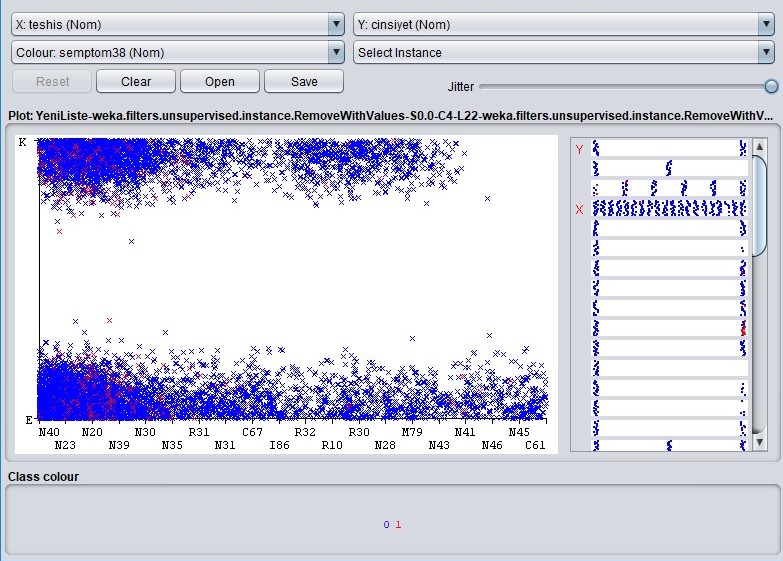
In the graph, the distribution of the diagnoses of female patients is shown above where the distribution of the diagnoses of male patients is shown below.
Decision Tree
Let's make classification according to the decision tree made based on the values given in Table 1.
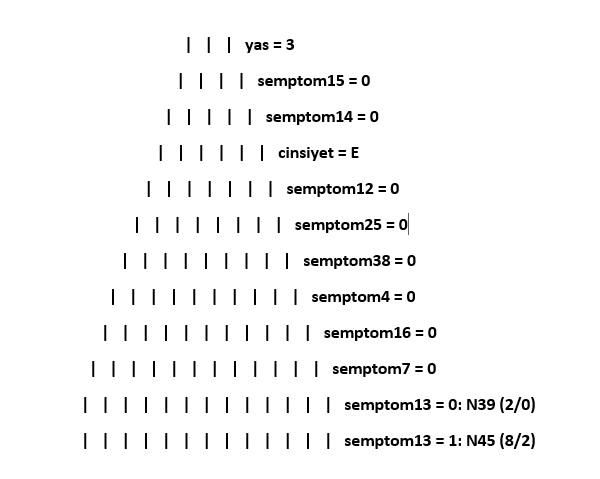
♦ When Age = 3 (25-40 / adulthood), Sex = Male, and Symptom13 = 1 (appeared), the incidence probability of N45 (Orchitis and epididymitis) is (8/2) 0.25.
♦ When Age = 5 (65-79 / old age), Symptom21 = 1 (appeared), and Symptom14 = 1 (appeared), the incidence probability of N20 (Calculus of kidney and ureter) is (4/2) 0.5.
♦ When Age = 5 (65-79 / old age), Symptom15 = 1 (appeared), the incidence probability of N39 (Other disorders of urinary system) is (8/2) 0.25.
Decision trees are the most widely used techniques in classification models because they are easy to set up, their results are easy to interpret, they can be easily integrated with database systems and they have good reliability.
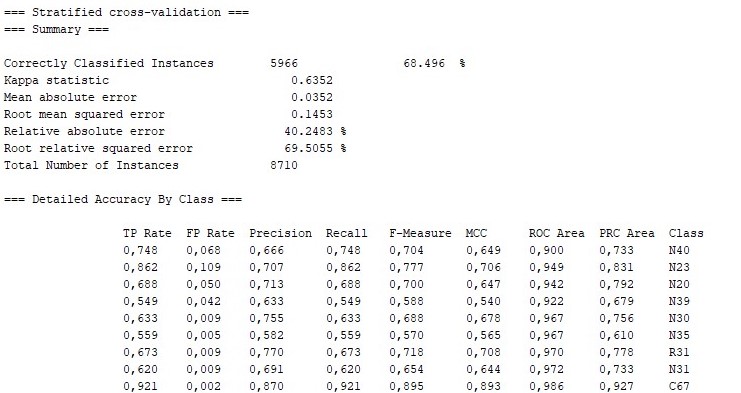
4. COMPARISON of MODELS
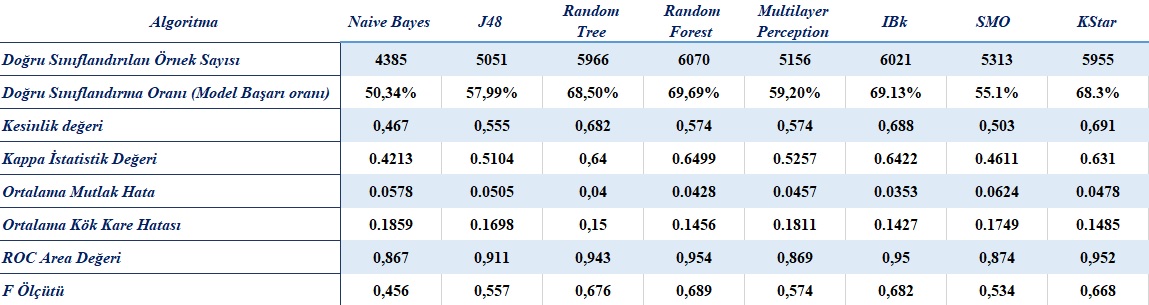
When the above-mentioned results were examined, it can be seen that the best results were obtained with RandomForest, as 69.69%. This algorithm is followed by the IBk, RandomTree and KStar algorithms.
The Kappa Statistical Value, is a statistical method that compares the observed accuracy with the expected accuracy, showing the concordance between assignments to existing classes. RandomForest a-Algorithm has the highest kappa statistical value with a value of 0.6499. The Kappa statistical value between 0.6 and 0.8 indicates that there is significant concordance and the estimation is not randomly made.
Criterion F was calculated as 0.689 where ROC Area Value was calculated as 0.954. These variables being close to 1 is preferable.
5. RESULTS
For physicians to make easier decisions, classification and rule extraction was performed using data mining methods for urological diseases. The 8710 data collected related to the urology branch were used for diagnosis and prognosis of diseases. Of the 8710 data given as input, 6070 were correctly classified. Among the obtained results via the computer-aided decision-making system in this study, 69.69% were found to be successful.
Computer programs are needed to create Data Mining applications. These programs include many algorithms such as data clustering, decision trees, Bayes classifiers, and apriori methods. Algorithms can extract information from processed data. In this study, analyzes were made using WEKA, one of the data-mining programs, and the results were examined. It was thought that the results obtained from the study would be beneficial for the urology branch.
6. REFERENCES
1. Reed R. Pruning algorithms- A survey, IEEE TRANS. ON NEURAL NETWORKS Vol. 4 (2), pp. 740-747, 1996
2. http://w3.gazi.edu.tr/~suatozdemir/teaching/dm/slides/01.DM.Intro.pdf
3. Pang-Ning Tan, Michael Steinbach, Vipin Kumar (2005). Introduction to Data Mining. Addison Wesley, ISBN: 0-321-32136-7
4. David J. Hand, Heikki Mannila, and Padhraic Smyth (2001). Principles of Data Mining. MIT Press. ISBN 026208290X
5. Weka: A Tool for Data preprocessing, Classification, Ensemble, Clustering and Association Rule Mining, Shweta Srivastava Assistant Professor (CSE Department) ABES Engineering College, Ghaziabad, International Journal of Computer Applications (0975 - 8887) Volume 88- No.10, February 2014 26
6. Arici H.," istatistik yontemler ve uygulamalar", Ankara, 1993.
7. https://www.academia.edu/30879162/veri_madenciligi_ve_turkiye_deki_uygulama_ornekleri
8. http://archive.ics.uci.edu/ml/datasets/Breast+Cancer+Wisconsin+(Diagnostic)
9. https://www.academia.edu/1941251/Veri_Madencili%C4%9Fi_Y%C3%B6ntemleri_Kullan%C4%B1larak_Meme_Kanseri_H%C3%BCcrelerinin_Tahmin_ve_Te%C5%9Fhisi
10. https://docplayer.biz.tr/15128771-Veri-madenciligi-siniflandirma-ve-kumeleme-teknikleri-yardimiyla-wisconsin-veriseti-uzerinde-gogus-kanseri-teshisi-hazirlayan-nury-amanmadov.html
Sisoft Healthcare Information Systems, focusing its eye on the world, is an achiement of quarter century of an effort in healthcare IT domain with advanced technology infrastructure and qualified staff.
Sisoft, is the leading company in Turkey, onHospital Information Systems
andHospital Information Management Systems
.Breaking News
Quick Links
Contact Us
Apollo Beach 33572
Florida / USA
Phone: +1 (646) 378 2138
Email: sisoft@sisoft.us
2024 © All Rights Reserved. NDA | Rights of Use